
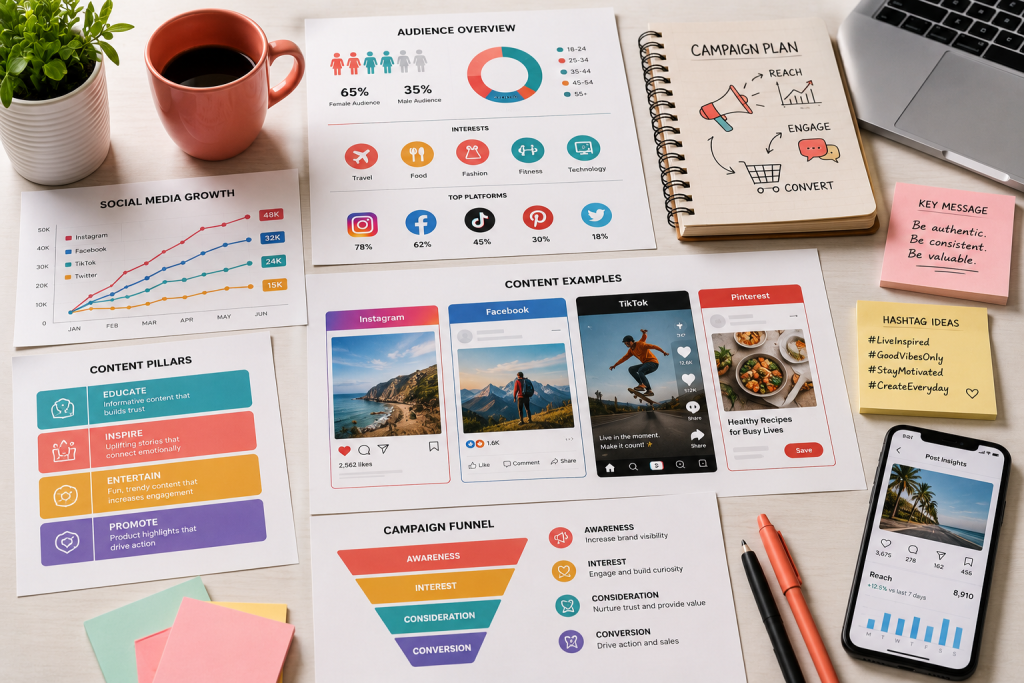
Reports, statistics and processes are important, but they are rarely exciting to read. Infographics solve this by turning complex information into visuals that people can understand at a glance, and are happy to share.
Why infographics work
People process images much faster than blocks of text. A well-designed infographic combines short text, numbers and visuals so readers grasp the key points quickly and remember them for longer.
Where businesses can use infographics
- Social media posts and carousels that explain a topic simply.
- Annual reports and company profiles that present results clearly.
- Sales presentations and pitch decks that make data persuasive.
- Training material and internal processes that teams need to follow.
- Blog articles and websites, where visuals increase time on page.
How to design an effective infographic
- Start with one story: decide the single message the infographic should communicate.
- Choose only the essential data: remove anything that does not support that message.
- Pick the right chart: bars for comparisons, lines for trends, timelines for history and flows for processes.
- Create a clear reading order: guide the eye from top to bottom or left to right.
- Stay on brand: use your colours, fonts and icon style so the infographic strengthens your identity.
- Cite your sources: credible data builds trust.
Design for every channel
One infographic can be adapted into several formats: a tall version for your blog, a carousel for Instagram and LinkedIn, and slides for presentations. Planning these versions from the start saves time and keeps everything consistent.
At Graphisco we turn data, reports and processes into clear, branded infographics for print and digital.
Have data that deserves a better design? Get in touch with Graphisco or message us on WhatsApp to discuss your project.
انفوگرافکس پیچیدہ ڈیٹا کو ایسے کانٹینٹ میں کیسے بدلتی ہیں جسے لوگ شیئر کریں
رپورٹس، اعداد و شمار اور طریقہ کار اہم ہوتے ہیں، مگر انہیں پڑھنا کم ہی دلچسپ ہوتا ہے۔ انفوگرافکس اس کا حل ہیں: یہ پیچیدہ معلومات کو ایسی تصاویر میں بدل دیتی ہیں جو ایک نظر میں سمجھ آ جائیں اور لوگ خوشی سے شیئر کریں۔
انفوگرافکس کیوں کام کرتی ہیں
لوگ تصاویر کو لمبے متن سے کہیں زیادہ تیزی سے سمجھتے ہیں۔ اچھی انفوگرافک مختصر متن، اعداد اور تصاویر کو ملا کر بناتی ہے، تاکہ پڑھنے والے اہم نکات جلدی سمجھیں اور دیر تک یاد رکھیں۔
کاروبار انفوگرافکس کہاں استعمال کر سکتے ہیں
- سوشل میڈیا پوسٹس اور کیروسلز جو کسی موضوع کو آسانی سے سمجھائیں۔
- سالانہ رپورٹس اور کمپنی پروفائلز جو نتائج واضح انداز میں دکھائیں۔
- سیلز پریزنٹیشنز اور پچ ڈیکس جو ڈیٹا کو قائل کرنے والا بنائیں۔
- ٹریننگ میٹیریل اور اندرونی طریقہ کار جن پر ٹیموں کو عمل کرنا ہو۔
- بلاگ آرٹیکلز اور ویب سائٹس، جہاں تصاویر وزیٹرز کو صفحے پر زیادہ دیر روکتی ہیں۔
مؤثر انفوگرافک کیسے ڈیزائن کریں
- ایک کہانی سے شروع کریں: طے کریں کہ انفوگرافک کون سا ایک پیغام دے گی۔
- صرف ضروری ڈیٹا رکھیں: جو چیز اس پیغام کو مضبوط نہ کرے اسے نکال دیں۔
- صحیح چارٹ چنیں: موازنے کے لیے بار، رجحان کے لیے لائن، تاریخ کے لیے ٹائم لائن اور طریقہ کار کے لیے فلو۔
- پڑھنے کی واضح ترتیب بنائیں: نظر کو اوپر سے نیچے یا ایک طرف سے دوسری طرف لے کر جائیں۔
- برانڈ کے مطابق رہیں: اپنے رنگ، فونٹس اور آئیکن اسٹائل استعمال کریں تاکہ انفوگرافک آپ کی پہچان مضبوط کرے۔
- ذرائع بتائیں: معتبر ڈیٹا اعتماد بناتا ہے۔
ہر چینل کے لیے ڈیزائن کریں
ایک ہی انفوگرافک کو کئی فارمیٹس میں ڈھالا جا سکتا ہے: بلاگ کے لیے لمبا ورژن، انسٹاگرام اور لنکڈ اِن کے لیے کیروسل، اور پریزنٹیشن کے لیے سلائیڈز۔ شروع سے یہ ورژنز پلان کرنے سے وقت بچتا ہے اور سب کچھ یکساں رہتا ہے۔
گرافسکو میں ہم ڈیٹا، رپورٹس اور طریقہ کار کو پرنٹ اور ڈیجیٹل کے لیے واضح اور برانڈڈ انفوگرافکس میں بدلتے ہیں۔
کیا آپ کے پاس ایسا ڈیٹا ہے جو بہتر ڈیزائن کا حق دار ہے؟ گرافسکو سے رابطہ کریں یا اپنے پراجیکٹ پر بات کرنے کے لیے ہمیں واٹس ایپ پر میسج کریں۔